
The idea of Threat Hunting in an organization can no longer be dismissed. No matter how mature your organization is regarding to this concept, you might be already doing some type of hunting already. However, how do you show the effectiveness of your hunting engagements? How do you show to your senior leadership the progress of your hunt team? There is the misconception of doing it by only tracking the number of incidents uncovered during hunting campaigns. However, in my opinion, it is is also important to consider if the right data is being collected, automation is being improved, and how much the team knows about its own environment when hunting for specific adversary techniques (You can change this and create your own metrics. This is just my opinion)
In this post, I will examine the MITRE ATT&CK framework in the form of a heat map in order to measure the effectiveness of a Hunt Team. I will use Excel (VLOOKUPs formulas & Conditional Formatting features) and the MITRE ATT&CK matrix structure to show you how to build your own heat map and start measuring the effectiveness of your hunt team for free.
Heat Map Goals:
- Provide transparency to senior leadership on threat hunting strengths and weaknesses
- Perform a gap analysis to demonstrate where resources are needed in your environment
- Emphasize the effectiveness of collaboration among other teams (In order to reach a very good or excellent score, you might need to work with other teams to fill the gap)
- Prioritize techniques based on the most crucial gaps identified
MITRE ATT&CK Framework
ATT&CK is a model and framework for describing the actions an adversary takes while operating within an enterprise network. The model can be used to better characterize post compromise adversary behavior with the goal of distilling common behaviors across known intrusion activity into individual or combinations of actions that an adversary may take to achieve their goals. The TTPs described in ATT&CK were selected based on observed APT intrusions from public reporting, and are included in the model at a level of abstraction necessary for effectively prioritizing defensive investments and comparing endpoint intrusion detection capabilities. [Source]
Get your own ATT&CK Matrix in Excel
Copy the MITRE ATT&CK Matrix
- Open Excel and create a new blank workbook
- Go to the MITRE ATT&CK techniques page and highlight the whole Matrix table
- Copy (CTRL + C) the highlighted table (make sure you highlight the whole table) and paste it (First cell A1 or R1C1) on your new blank workbook as shown in figure 1 and 2 below. Even though you paste it on the first row, it is pasted starting on the second one. Just delete the first row.
 |
| Figure 1: Copying MITRE ATT&CK Matrix |
 |
| Figure 2: Copying Matrix to Excel |
Edit your Matrix Table
Remove Hyperlinks from the whole table at once as shown in figure 3 below. Your table might not have borders anymore so just highlight your whole table and add borders to it as shown in figures 4, 5 and 6 below.
 |
| Figure 3: Remove Hyperlinks |
 |
| Figure 4: Table without Hyperlinks |
 |
| Figure 5: Add "All Borders" to your table |
 |
| Figure 6: Plain MITRE Matrix table |
Once you have everything as a table again, you will notice that several cells have long text that needs to be wrapped into several lines to fit better. Highlight your table again and use the "Wrap Text" option as shown in figure 7 below.
 |
| Figure 7: Wrapping up long-text |
Now, the table should be ready to be used for our heat map. Add colors to your header, adjust the font size, etc. Save your document and give your worksheet a name. I named mine "HeatMap" as shown in figure 8 below.
 |
| Figure 8: Matrix Ready for our Heat Map |
UPDATE 09/10/2017: Get your own ATT&CK Matrix in Excel
- I developed a PowerShell script that I named Invoke-ATTACKAPI which leverages the MITRE ATTACK API to interact directly with the MITRE ATTACK framework and pull valuable information all at once.
- I use this script now to update my ATTACK Enterprise Matrix
- All you need to do is run the following command to get the same results as above:
Invoke-ATTACKAPI -Matrix | select Persistence, 'Privilege Escalation', 'Defense Evasion','Credential Access',
Discovery, 'Lateral Movement', Execution, Collection, Exfiltration, 'Command and Control' |
Export-Csv C:\documents\matrix.csv -NoTypeInformation
Define Your Scoring System
You need to define your scoring system and set specific criterias that you would like to use to measure how effective your team is at detecting specific adversary techniques.
A few basic steps:
- You can start by setting your rating system levels (None, Poor, Fair, Good, Very Good & Excellent).
- You can then assign a color to each score (Keep in mind you are creating a heat map).
- Map a number to each level (0,1,2..5) as shown in figure 9 below.
- Finally assign key focus points for each level. One example could be what I show in figure 9 below.
As I mentioned at the beginning of this post, tracking how many incidents get uncovered during a hunting campaign should not be considered as the ONLY indicator of an effective hunt team. Why? What if you do not find anything? Does that mean that your team is not good?. In my opinion, validating the detection of a specific adversary technique by focusing on having right data, improving the automation of hunting procedures, and knowing your environment should be also considered when determining the effectiveness of a hunt team. For example, you can focus on the following key points (This is a basic example. I recommend you come up with your own ones):
- None:
- Not enough data to detect a specific adversary technique (i.e. hunting with only Windows Security Event Logs when hunting for PowerShell activity). Also, not centralizing the amount of data needed to hunt across the whole enterprise.
- Poor:
- Sending all your logs to a central repository. If you "hunting" on one endpoint at the time, you are NOT being effective at all ! (Consider Splunk, ELK, etc)
- Creating basic signatures or correlation rules to detect specific activity. Usually this is done by correlating two to three events. Also, here is where you might have Threat Intel feeds helping your routine hunts (IOC Sweeps).
- Running queries and trying to make sense of the data without automating certain hunting procedures that could make your hunt more effective and efficient. (i.e. After running a few queries in your SIEM you might still have thousands or hundreds of events that you will still need to go through and maybe correlate them with other events to find outliers)
- Fair:
- Collecting the right data (NOT JUST MORE DATA) to improve the detection of an adversary technique. Here is where you start adding Sysmon Logs, ETW, PowerShell logs, netflow, etc). Without the right tools or processes to aggregate and make sense of all the data, your team might not be effective yet. Hunters might be running queries and still get a very high amount of events that still need to be filtered to reduce the amount of data that needs to be analyzed.
- Good:
- Correlating and integrating numerous data types across all your endpoints in order to filter out noise and potential false positives. Here is where you star using a few basic Data Science techniques in order to make sense of all the data that you have in your central repository (Better Automation)
- Very Good:
- Leveraging more than just simple outlier detection techniques. Here is where your team starts using advanced data science techniques to detect the known and unknown (Of course, data science concepts such as Machine Learning cannot be applied to every single use case or technique that you are trying to detect. If you can validate the detection of an adversary technique by just applying basic data science techniques, then you might be already in the "Very Good" level.
- Excellent:
- Here is where your team is very proficient at everything above and very effective at detecting adversary techniques, but with also a very good understanding of the environment (Beyond just having the right automation and data. If you do not understand exactly how certain activity relates to your environment then you might be missing stuff).
Remember that the table below needs to be created on a new sheet in the same Workbook where you created your ATT&CK Matrix. ( I named mine "Score Defs")
 |
| Figure 9: Basic Scoring System table |
Define each Adversary Technique
Set your own "All Techniques" Page
- Go to the MITRE ATT&CK "All Techniques" page and highlight the whole table (Same way how you did it with the matrix earlier)
- Copy (CTRL + C) the highlighted table (make sure you highlight the whole table) and paste it (First cell A1 or R1C1) on a new sheet in the same workbook.
- You will basically have to do the same adjustments you did to the MITRE ATT&CK matrix (wrap-text, font size, All Borders, Remove Hyperlinks, etc).
- Make sure you go over the whole table and adjust certain parts of the table that might have not copied properly.
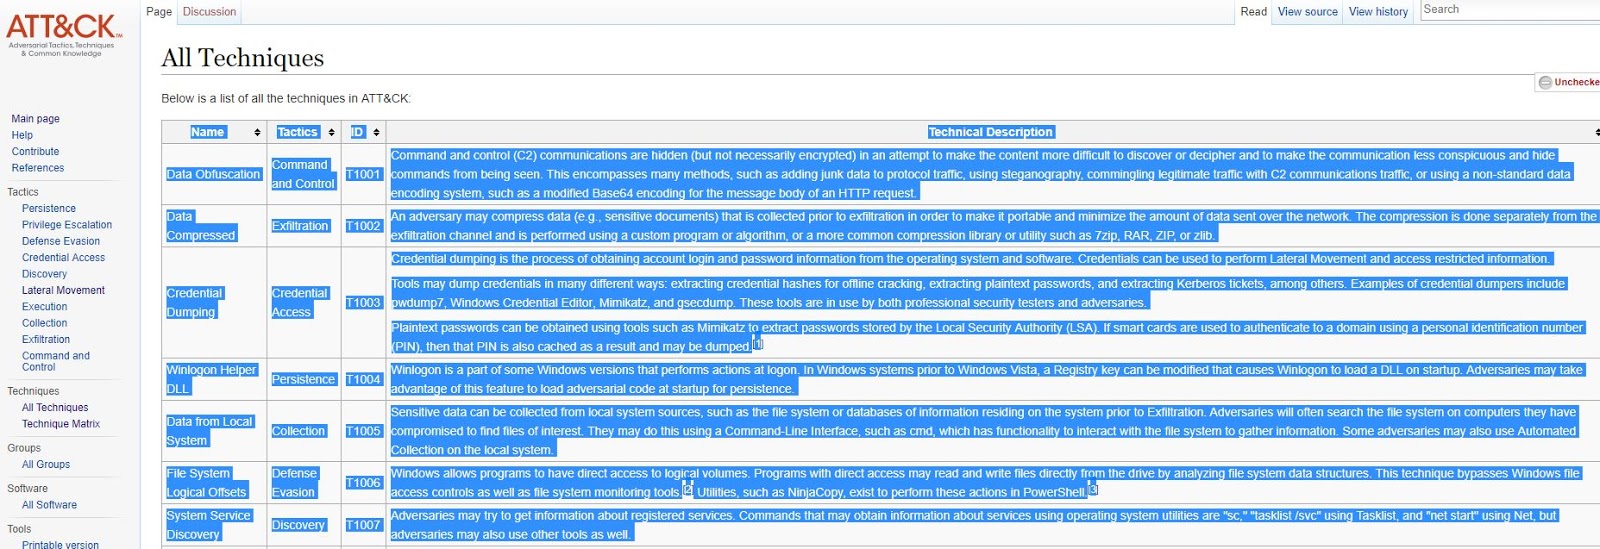 |
| Figure 10: "All Techniques" Page |
Once you have a table with everything from the "All Techniques" page, then you will have to add a few columns to add more context to it and integrate it with your Heat Map.
- I added two columns, one named "Detection Approach" and another one named "Data Sources". In the MITRE ATT&CK "All Techniques" page, I clicked on every single technique and grabbed the Detection approach and data sources needed to help me detect the specific technique.
- I also Added another one named "Detection Score". Here you will have to review one by one with your team and give it a score following your "Score Defs sheet" (None, Poor, Fair, Good, Very Good, Excellent).
- Finally, I added a column named "Tools". I use this to identify what current tools would help me hunt for a specific adversary technique. This is very helpful to also show vendors how much they are contributing to your detection/hunting capabilities (Vendors selling you EDR maybe?).
 |
| Figure 11: All Techniques Table |
UPDATE 09/10/2017: Define each adversary technique
- I developed a PowerShell script that I named Invoke-ATTACKAPI which leverages the MITRE ATTACK API to interact directly with the MITRE ATTACK framework and pull valuable information all at once.
- I use this script now to update my adversary technique sheet
- All you need to do is run the following command to get the same results before adding 'Detection Score' And tools columns:
Invoke-ATTACKAPI -Category -Technique | select @{Name="Name"; Expression={$_.Name -join ","}}, @{Name="Tactic"; Expression={$_.Tactic -join ","}}, @{Name ="ID"; Expression={$_.ID -join ","}}, @{Name="Description"; Expression={$_.Description -join ","}}, @{Name="Analytic details"; Expression={$_.'Analytic Details' -join ","}}, @{Name="Data Source"; Expression={$_.'Data Source' -join ","}} | export-csv F:\wardog\scripts\techniques.csv -NoTypeInformation
Set a Detection Score Drop-Down List
I added a "Detection Score" column and was able to assign a score to each technique. What if we want to change the score? Do we delete the text and type it again?. I recommend to use n Excel feature named "Data Validation" under the "Data" tab. This limits the type of data that can be entered in a cell. This will help us to have a drop-down menu to pick from the 6 different levels of the rating system.
- Highlight all your Detection score cells, click on the tab named "Data", and on "Data Validation" as shown in figure 12 below.
- A window will pop up where you will have to select the list of values that you will want to use as part of your drop-down menu.
- Click inside of the "Source" box and then click on the "Score Defs" sheet. Highlight the six levels (None, Poor, Fair, Good, Very Good, Excellent) and click Okay as shown in figure 14 below.
- You will be able to now just hover over the right edge of the cells below the "Detection Score" column and you will have 6 options as shown in figure 15 below.
 |
| Figure 12: Highlighting "Detection Score" cells |
 |
| Figure 13: Selecting a Source list |
 |
| Figure 14: Getting values from the Score Defs sheet |
 |
| Figure 15: Drop-Down list enabled on Detection Score cells. |
Integrate All the Sheets
Heat Map Sheet: Add Scoring Columns
Add a blank column to the right of each tactical group as shown in figure 16 below. There is where you will sync the score you set for each technique in the "Detailed Technique" sheet.
 |
| Figure 16: Adding extra columns to the Heat Map. |
Heat Map Sheet: VLOOKUPS
If your Excel version sets your Columns to be numbers instead of being letters, then you have the R1C1 reference style option enabled by default. If you are not comfortable with the R1C1 Reference style of your table, then you need to disable that feature by going to File> Option > Formulas ,un-check R1C1 reference style feature and click OK as shown in figure 17 below.
 |
| Figure 17: Disable R1C1 Reference Style |
Now you should be good to start setting your VLOOKUP formulas. First, Highlight the first cell next to the first Persistence technique ("Accessibility Features").
Copy the text below into the Formula bar as shown in figure 17:
=VLOOKUP(VLOOKUP(A2,'Detailed Techniques'!A:G,7,0),'Score Defs'!A:B,2,0)
- A2 is the cell to the left of the cell you highlighted (The Adversary Technique). That's the value we are going to be looking for first.
- ''Detailed Techniques'!A:G,7,0)
- The first value in quotes is the name of the Sheet where you will look value in cell A2.
- !AG: Table Range
- The second value after the comma (7) is the "Detection Score" column number where we will collect the score value for the specific adversary technique that we were looking for (A2 = Accessibility Features)
- The last value after the last comma (0) and before the ")" is basically saying "Match the exact value" that I am looking for (not fuzzy matching).
- 'Score Defs'!A:B,2,0)
- The first value in quotes again is just pointing to the "Score Defs" sheet where you will now look for the Score string retrieved from the "Detailed Technique" sheet.
- The second value after the first comma (2) is the "Integer Mapping" column number where we will collect the value (number) in relation to the specific score level (None, Poor, Fair, Good, Very Good or Excellent).
- The last value after the last comma (0) and before the ")" is basically saying "Match the exact value" that I am looking for (not fuzzy matching).
As you can see below, after entering the formula from above, I got a value of Zero which means that I set the score for Accessibility Features to be "NONE" ( Not data available for that technique)
 |
| Figure 18: Double VLOOKUP to get a score value for each technique |
Now in order to test your formula with other techniques in the same column, select the cell with the number "0" and drag the bottom right corner of the cell down to apply the same formula to all the columns below as you can see in figure 19 below.
 |
| Figure 19: Double VLOOKUP to get a score value for each technique |
There will be cells that will be just blank, and in order to not get any error messages, we just have to add a conditional to the formula. Replace the first formula with the following:
=IF(ISNA(VLOOKUP(VLOOKUP(A2,'Detailed Techniques'!A:G,7,0),'Score Defs'!A:B,2,0)),"",VLOOKUP(VLOOKUP(A2,'Detailed Techniques'!A:G,7,0),'Score Defs'!A:B,2,0))
 |
| Figure 20: Double VLOOKUP with IF conditional to show empty cells where there are not techniques. |
Heat Map: Locking Cell Values in Formula
Next, we have to copy the same formulas to the other columns and we want to make sure that our table ranges from our "Score Defs" and "Detailed Techniques" stay the same. The only value that should change is value of the first cell to the right of each technique. You can lock parts of your formula by doing the following:
- Click on the first cell where you created the firs formula (B2)
- Place your cursor on the Table Range of each sheet and press F4
- You will see the table range values with Dollar Signs next to their parameters as shown in figure 21 below.
 |
| Figure 21: Lock cell values |
Then, copy the first cell to the right of "Accessibility Features" under persistence, and paste it at the beginning of each column to the right of each technique. Then, drag the bottom right corner of each cell with the formula down until the last technique of each column as shown in figure 22 below. You will see that every single technique now has a value associated to its rate level.
 |
| Figure 22: All the values from the Detailed techniques and Score Defs are synced |
Add Colors to your Heat Map
Get your RGB Color Values
First get the RGB values of all your rate levels. You can do that by going to your "Score Defs", clicking on the rate cell and checking its "More colors" settings of the fill color as shown in figure 23 below. Do the same for every single color. Let me share my RGB values just in case you like mine:
0 = RGB 255 79 79
1 = RGB 255 119 87
2 = RGB 255 174 93
3 = RGB 242 245 123
4 = RGB 209 220 255
5 = RGB 125 156 255
 |
| Figure 23: RGB Value of Poor/1. |
Conditional Formatting: Creating Rules
Once you have all your RGB values written down, go to your "HeatMap" sheet and highlight the whole table. Do the following:
- Click on Conditional Formatting > New Rule as shown in figure 24 below
- Select "Use a formula to determine which cells to format" (Figure 25)
- In the "Format values where this formula is true", type: =B2=1 (Figure 26)
- Click on Format > More Colors> and set the RGB value for the Rate Poor=1.
- Click OK> OK > OK (Figure 27)
- You should now see all the techniques where the effectiveness of the Hunt team was set to 1 as orange as shown in figure 28
 |
| Figure 24: Creating a new rule. |
 |
| Figure 25: Setting the rule type. |
 |
| Figure 26: Set the values where the formula is true. |
 |
| Figure 27: Setting the RGB value.. |
 |
| Figure 28: Poor values. |
Next, create the rest of the rules for the rate values of 2, 3, 4 , 5, 0 and "" (BLANK) Yes you have to create a BLANK rule at the end. Make the "" rule your last rule and set it to "No color" (The rule should show up as the first top rule). That rule should look like something like this: =B2="" .
Once you have all the rules in place, your heat map should look like this:
 |
| Figure 29: Your First Heat Map. |
Bonus: Effectiveness Trend
You can add up all the values per tactical group, get the average number and show a chart with a summary of how effective your hunt team is per tactical group and per quarter. (Your Boss will love this)
 |
| Figure 30: Effectiveness Trend Over Time. |
Test your Heat Map: Take Care of the Basics
Lets say you start sending all your native windows event logs to a central repository and start collecting Sysmon logs too. You will see techniques going from None to Poor or Fair (This is just an example). Remember that even though we might have some extra visibility, you still would have to go through a lot of data and analyze several events if you do not improve the automation of certain hunting procedures. Several adversary techniques require more than just a simple correlation rule or signature. Also, we are measuring the effectiveness of the Hunt Team and not just how many incidents get uncovered during the hunting campaign.
 |
| Figure 31: Heat Map update |
Final Thoughts
I hope this was very helpful for those Hunt Teams that would like to give themselves an idea of how effective their hunt team is. This is one of many ways that you can put metrics towards your hunting campaigns.
For those that would like to just download the template and start using it right away, you can find it in the metrics folder of the ThreatHunter-Playbook
URL: https://github.com/Cyb3rWard0g/ThreatHunter-Playbook/blob/master/metrics/HuntTeam_HeatMap.xlsx
if you would like to contribute to the ThreatHunter-Playbook, just send a PR !
Feedback is greatly appreciated! Thank you.